Look it up and you may find different answers. Here are the average benefit by category of beneficiary.
No matter how you slice it, living on Social Security alone should not be the goal.
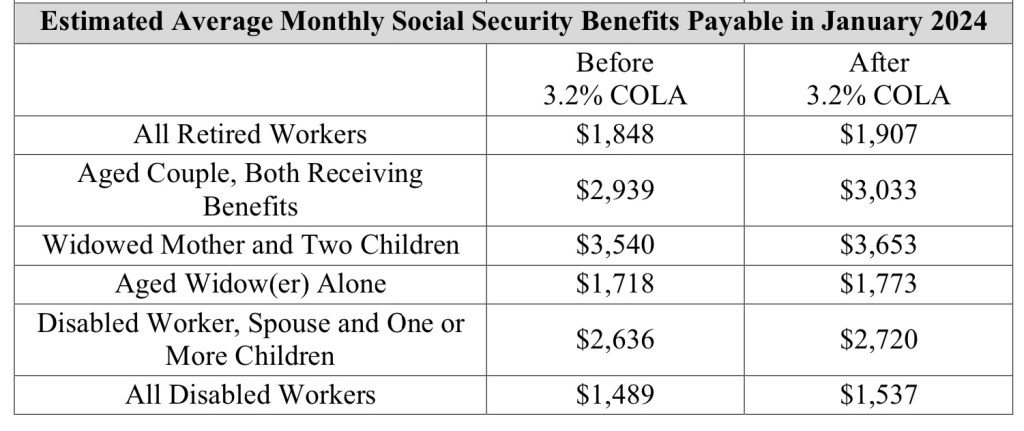
Prepared by the Social Security Administration

We can’t control what others do and we can’t stop misfortune from striking. But we can control our own actions. Those who are financially prudent will most likely enjoy success, even if events don’t always go their way.
Look it up and you may find different answers. Here are the average benefit by category of beneficiary.
No matter how you slice it, living on Social Security alone should not be the goal.
Prepared by the Social Security Administration


Averages are deceiving. You take a guy, put his head in the oven and his feet in a freezer, his average temperature is 98.6, but he is dead.
How do you adjust for those who only worked 10 years – versus those who paid in for 50+ years? Or, how to adjust for those who commenced at age 62 – versus age 70? And, how to adjust for those whose wage consistently exceeded the wage base – versus those whose wage was consistently in the lowest quintile or who had significant gaps in earnings, years without earnings?
Medians wouldn’t be any better.
Regardless, the better answer is to look at the formulaic replacement (SSPIA) of average indexed monthly earnings (earnings over 35 years, adjusted for inflation)- which, for those who reach age 62 in 2023, ranges from 90% for those with average income (AIME) of < $13,380, and for someone at the midpoint of the second bend point, an AIME of $3,918, $47,016 annualized, that would be $1,900 a month, or $22,805 a year, or a replacement rate of 48.5% (($13,380*.9)+($33,636 * .32)).
LikeLike
Of course, the average benefit CURRENTLY is based on many who retired when $30,000 or less was a good income.
LikeLike