
Learn some facts…
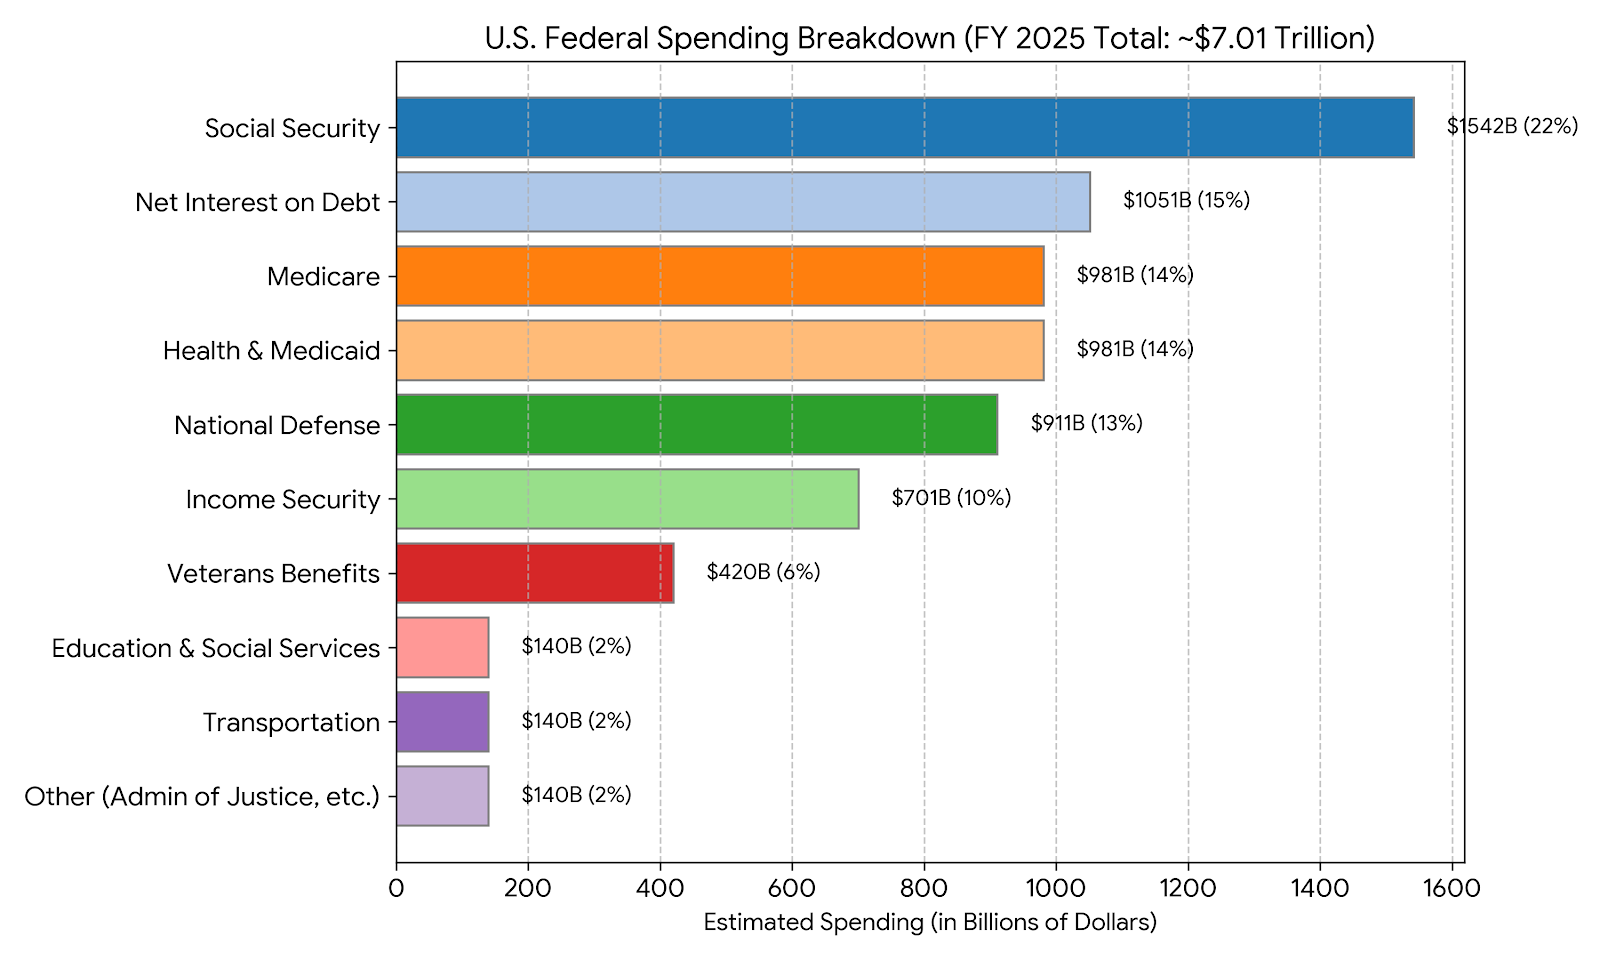
The Data at a Glance
Here is the exact data used to construct the visual, showing how the total budget divides across major functions:
Budget Category % of Budget Estimated Amount (Billions)
Social Security 22% $1,542B
Net Interest on Debt 15% $1,051B
Medicare 14% $981B
Health & Medicaid 14%% $981B
National Defense 13% % $911B (increasing)
Income Security (SNAP, SSI, Child Tax Credits, etc.) 10% $701B
Veterans Benefits and Services 6% $420B
Education, Training, & Social Services 2%$140B
Transportation 2% $140B
Other (Administration of Justice, Agriculture, foreign aid, etc.) 2% $140B
Oh yeah, about fraud…estimated at 1-2%


$140 Billion of fraud is not chump change. Most of the other costs are historically legislated.
LikeLike
It’s still 1% of spending. Trump shouldn’t have fired the inspectors generals. He should have added to them instead of more rhetoric.
LikeLike